
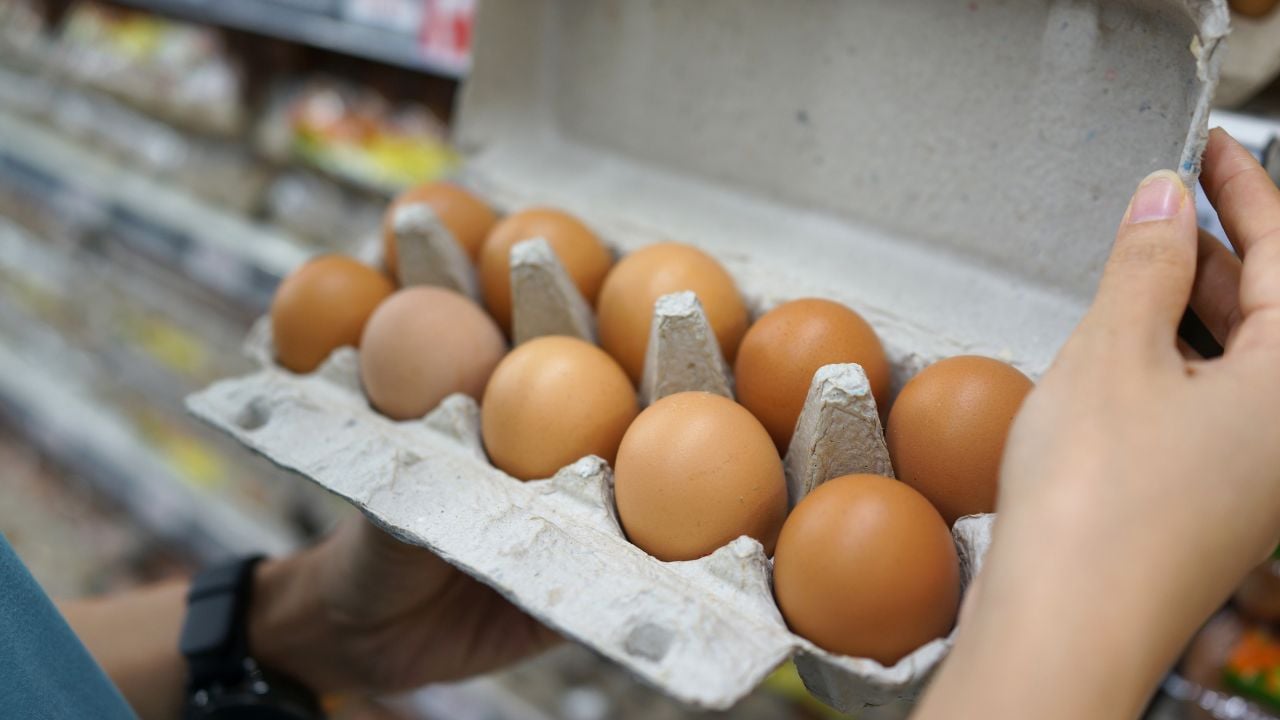
Egg Prices Fell 23% Nationally in a Year, but Dairy Fell Just 0.3%, a Gap Hitting Kansans Hard

Farmers are getting less for their eggs and milk than they were a year ago.
At the store, the drop hasn’t kept pace, especially for dairy.
Here’s what the numbers show, and what could change for Kansans in the weeks ahead.
Note: This is general information, not financial advice. Prices and forecasts are subject to change, so check the newest release from USDA’s Economic Research Service.
Egg Prices Versus Last Year
The U.S. Department of Agriculture (USDA) has a team called the Economic Research Service (ERS) that tracks food prices.
It says egg prices were 20.6% lower in September 2026 than in September 2025.
That figure comes from the October 2026 edition of ERS’s Food Price Outlook.
It uses the September Consumer Price Index (CPI), a government measure of how prices change.
The Bureau of Labor Statistics (BLS) shows what that looks like at checkout.
A dozen Grade A large eggs averaged $2.27 nationwide in September 2026.
A year earlier, that dozen averaged $3.49, so you’d have paid about $1.22 more.
If you buy a dozen every week, that is about $63 a year.
That’s a 34.9% drop.
The 20.6% and the 34.9% differ in part because they measure different things.
ERS tracks a price index for eggs.
BLS tracks the average dollar price of one product, a dozen Grade A large eggs.
For 2026 as a whole, ERS forecasts egg prices 29.3% lower than in 2025.
Its forecast range is 26.7% to 31.6% lower.
It isn’t a straight line, though.
Egg prices rose 1.0% from August to September 2026.
So the drop from a year ago hasn’t meant a decline every month.
Eggs in 2025
Eggs cost a lot in 2025. Prices averaged 21.9% more than in 2024, ERS reports.
So any comparison with last year starts from a high base.
On the farm, egg prices fell 75.3% from September 2025 to September 2026.
That’s a far bigger drop than the 20.6% at the store.
Farm egg prices also move fast. Between August and September 2026, they fell 39.7%.
You’ll find the farm-level figures in the same ERS report as the retail ones.
The Math Behind USDA’s Egg Price Outlook
ERS’s yearly egg forecasts compare one year’s average with the previous year’s average, not single months.
Here is why that matters. The 2025 average was already up 21.9% on 2024. The forecast has 2026 falling 29.3% from that 2025 average.
Multiply 1.219 by 0.707, and you get about 0.86. So the forecast puts 2026 egg prices about 14% below 2024.
At the ends of the forecast range, the gap runs from about 11% to about 17% below 2024. In plain words, eggs would cost less than they did in 2024, too.
Where Dairy Prices Stand
Dairy has barely budged.
Retail dairy prices fell 0.7% from September 2025 to September 2026.
For 2026 as a whole, ERS forecasts dairy prices 0.4% lower. The forecast range runs from 0.8% lower to 0.1% higher.
That range crosses zero, so dairy could end up a little lower or a little higher.
It’s also far narrower than the one for eggs, about 0.9 percentage points wide against 4.9.
The BLS Consumer Price Index for September 2026 points the same way. Its dairy and related products index fell 0.7% over the year.
Whether your dairy bill is steady depends on whether you put milk, cheese or ice cream in your cart.
Psst! How do eggs and dairy compare with the rest of your grocery bill? Sort the table and see where each item lands.
Milk, Cheese and Ice Cream
A gallon of whole milk averaged $4.11 in September 2026, down from $4.13.
That’s a dip of about 2 cents, or 0.6%.
Cheese was mixed.
Natural cheddar averaged $6.13 a pound, up 1.4% from a year earlier. American processed cheese averaged $4.74, down 3.8%.
Ice cream fell furthest.
A half gallon of regular prepackaged ice cream averaged $5.93, down about 47 cents, or 7.3%, from a year earlier.
So if you load up on processed cheese and ice cream, you got a bit of a break.
Milk is a hair lower.
The BLS table lists each of these averages.
Kansas Milk Production
Kansas dairy farms grew their milk output far faster than the country did in September 2026.
Output rose 14.7% to 492 million pounds, according to USDA’s National Agricultural Statistics Service (NASS).
Nationwide, output rose 2.6% over the same stretch. That’s more than five times the national rate of growth.
Kansas made about 2.5% of U.S. milk in September 2026. That’s a small slice, but a growing one.
Kansas had 248,000 milk cows in September 2026, up 29,000, or 13.2%, from a year earlier.
Output per cow rose just 1.3%, so most of the growth came from a bigger herd.
Now to your wallet.
Farm-level milk prices fell 11.8% from September 2025 to September 2026, ERS reports.
Retail dairy prices fell only 0.7%.
Shelf prices barely moved.
For 2026 as a whole, the forecast is farm-level milk prices 10.5% lower, within a range of 7.0% to 13.4% lower.
If you’re wondering why a bigger milk supply isn’t cutting your dairy bill, farm prices are falling much faster than shelf prices.
Psst! How much do you know about eggs and dairy? Take our quiz and see how many you can get right.
Quiz
Egg and Dairy IQ
Answer these questions on eggs, dairy and the farms behind them. We bet you can’t get them all right. Prove us wrong?
What does the USDA grade shield on an egg carton mean?
Watching the Outlook
ERS usually updates its Food Price Outlook on the 25th of the month, or earlier when the 25th falls on a weekend or holiday.
The next update is scheduled for Nov. 24, 2026.
The figures here come from the October 2026 edition, released Oct. 23.
It used the September CPI.
Across the whole grocery bill, food-at-home prices are forecast 2.3% higher for 2026.
You can download the forecasts as Excel or CSV files, or use its interactive visualization tool.
BLS publishes the October CPI on Nov. 10 and the November CPI on Dec. 10.
These are national figures.
Prices at your store can differ.
The Census Bureau counts Kansas in the Midwest region.
The BLS average price table has a Midwest column beside the U.S. column.
But BLS leaves the Midwest blank for eggs, milk, cheese and ice cream in September 2026.
ERS puts a forecast range on each figure to show how unsure it is.
For 2027, the range on food-at-home prices runs from 5.2% lower to 7.5% higher, around a forecast of 1.0% higher.
17 Sneaky Grocery Store Tricks That Get Kansans to Spend More Money

Many Kansas grocery stores are laid out to move you through the aisles in a certain order.
These are the tricks that can get Kansans to spend more money.
17 Sneaky Grocery Store Tricks That Get Kansans to Spend More Money
6 Things Kansans Scramble to Finish Before the First Hard Freeze
A first hard freeze can send many Kansans scrambling through yards, gardens and garages.
These are the things many Kansans scramble to finish before it arrives.
6 Things Kansans Scramble to Finish Before the First Hard Freeze
